> ## Documentation Index
> Fetch the complete documentation index at: https://docs.blockscout.com/llms.txt
> Use this file to discover all available pages before exploring further.
# Charts And Stats
> New Blockscout stats service
 ## Description
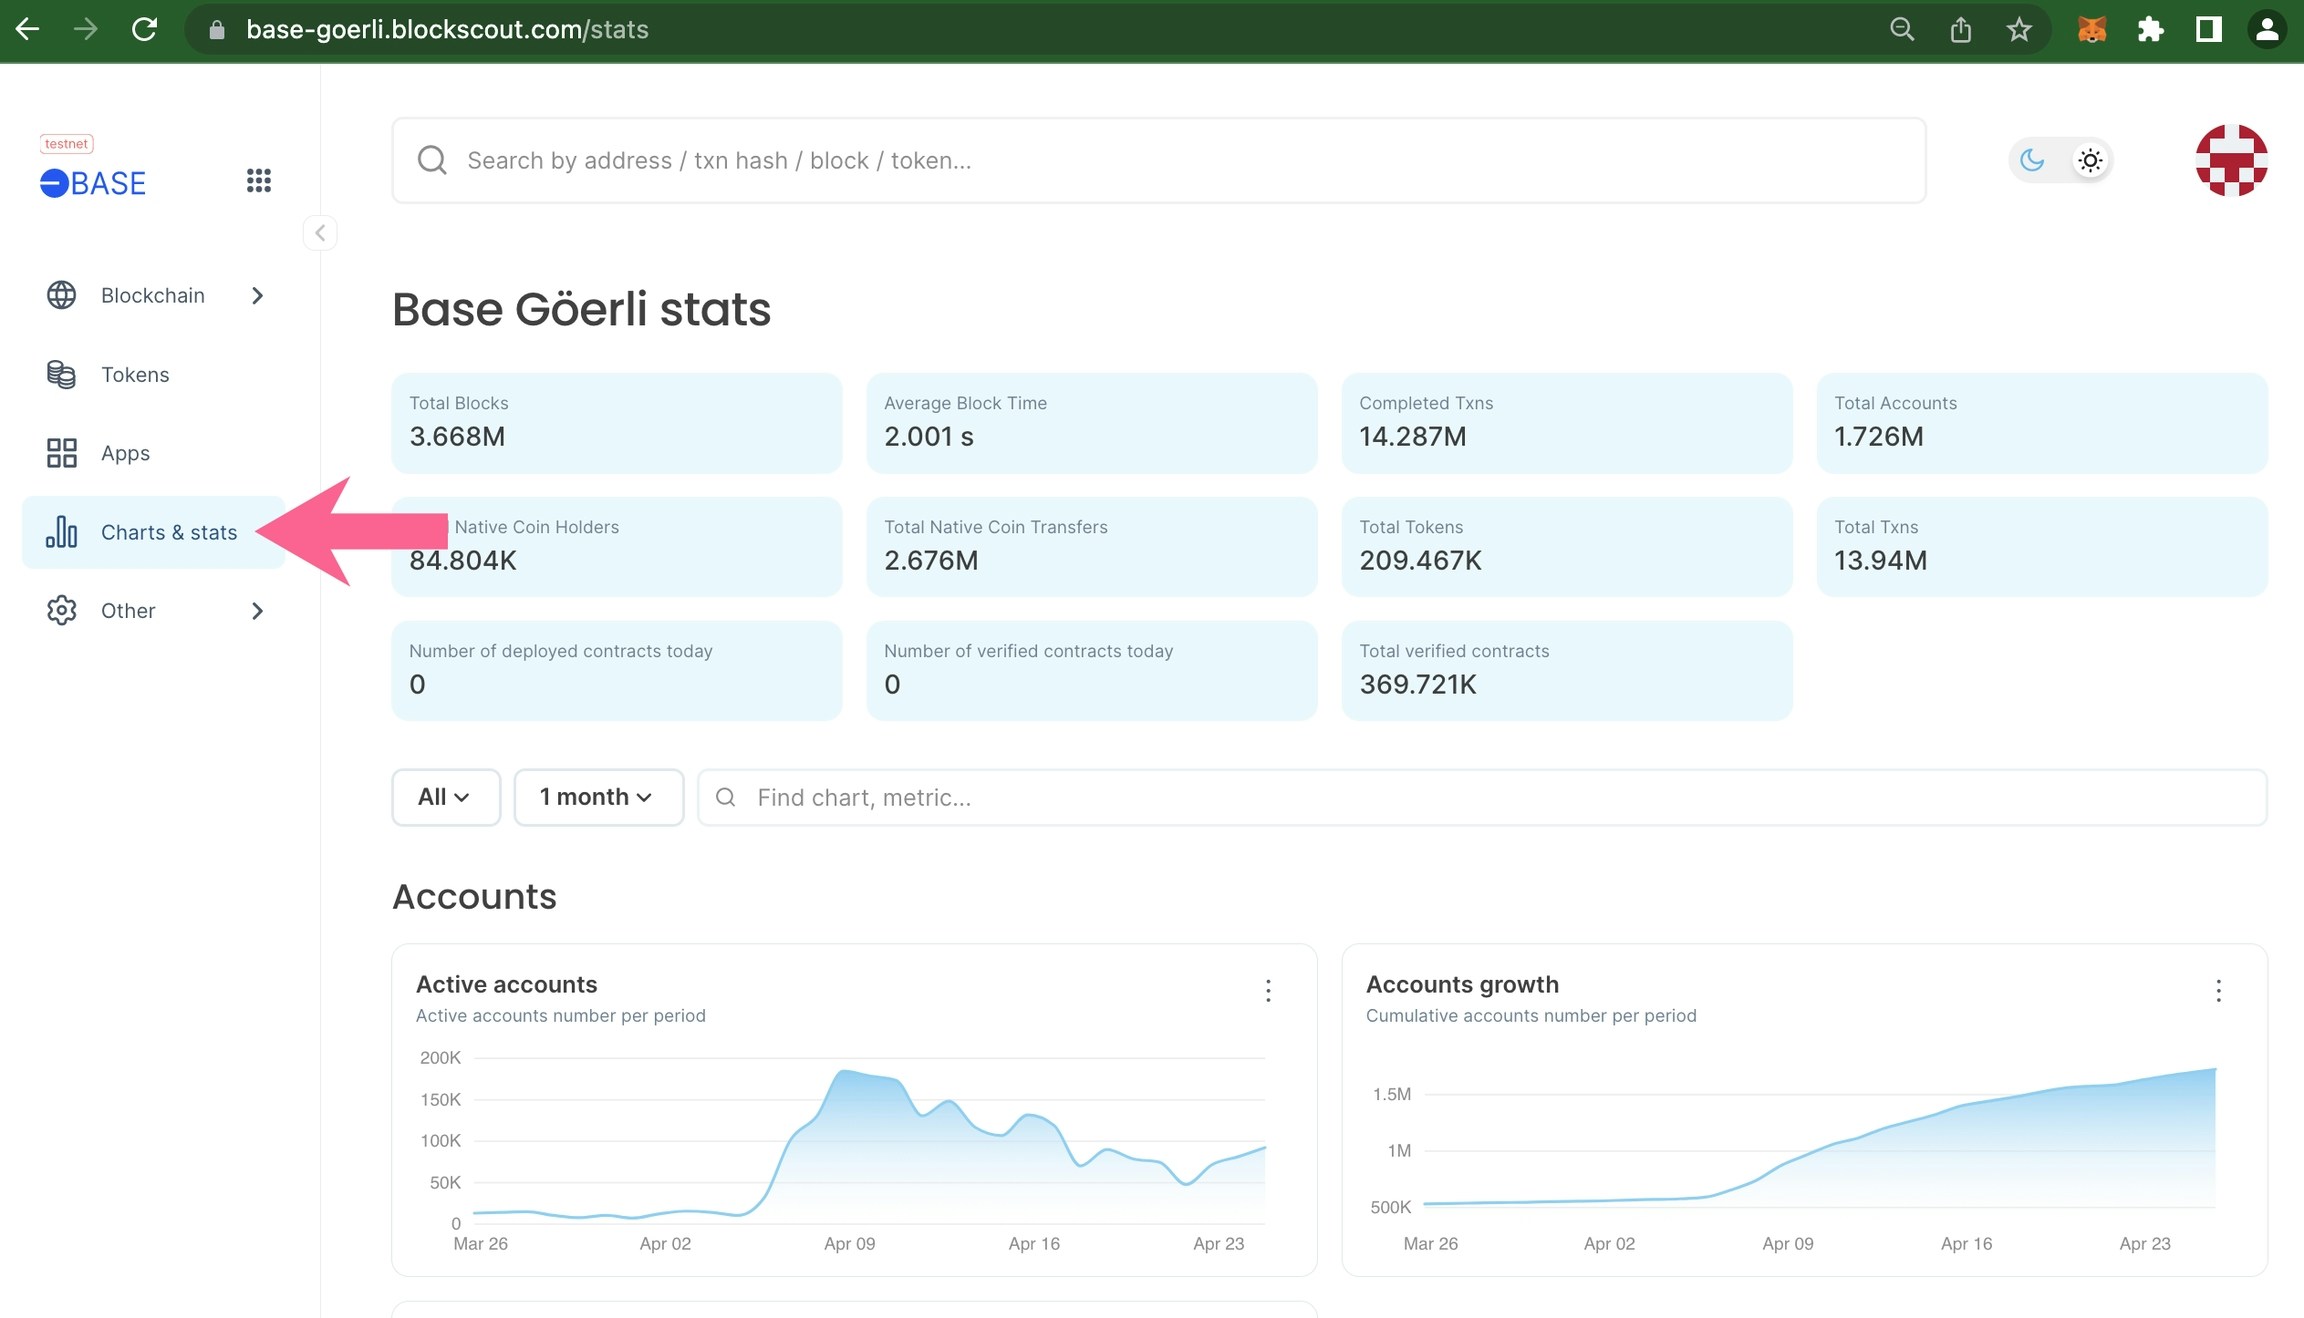
Blockscout provides a way to easily calculate and display chain-relevant charts and statistics. For example, it can calculate and display the number of blocks per day, the average block reward, or the number of active accounts per day.
Statistics are implemented using a separate microservice that is connected to the indexed blockscout database. The source code and full README.md for the service is available here: [https://github.com/blockscout/blockscout-rs/tree/main/stats](https://github.com/blockscout/blockscout-rs/tree/main/stats)
On start, the service performs initial calculations for all charts. After that, each chart updates independently according to its `update_schedule`.
## Cache
It’s better to run the service after blockscout has finished the indexing process. During indexing blockscout database contains partial information about the blockchain, so statistics may be inaccurate.
The stats service will try to use cache values for efficient chart recalculation. If you decide to run statistics during indexing, rerun the service with
## Description
Blockscout provides a way to easily calculate and display chain-relevant charts and statistics. For example, it can calculate and display the number of blocks per day, the average block reward, or the number of active accounts per day.
Statistics are implemented using a separate microservice that is connected to the indexed blockscout database. The source code and full README.md for the service is available here: [https://github.com/blockscout/blockscout-rs/tree/main/stats](https://github.com/blockscout/blockscout-rs/tree/main/stats)
On start, the service performs initial calculations for all charts. After that, each chart updates independently according to its `update_schedule`.
## Cache
It’s better to run the service after blockscout has finished the indexing process. During indexing blockscout database contains partial information about the blockchain, so statistics may be inaccurate.
The stats service will try to use cache values for efficient chart recalculation. If you decide to run statistics during indexing, rerun the service with
`STATS__FORCE_UPDATE_ON_START=true` env variable once indexing is finished to perform a full update of all charts.
## How to run
Options including docker, docker-compose or building from source. -> [https://github.com/blockscout/blockscout-rs/tree/main/stats#build](https://github.com/blockscout/blockscout-rs/tree/main/stats#build)
## Configs
* Env variables [https://github.com/blockscout/blockscout-rs/tree/main/stats#env](https://github.com/blockscout/blockscout-rs/tree/main/stats#env)
* .env example: [https://github.com/blockscout/blockscout/blob/master/docker-compose/envs/common-stats.env](https://github.com/blockscout/blockscout/blob/master/docker-compose/envs/common-stats.env)
## Chart Types
Two types of charts are available for the Charts and Stats Section, `Line`charts and `Counter` charts.
### Line Charts
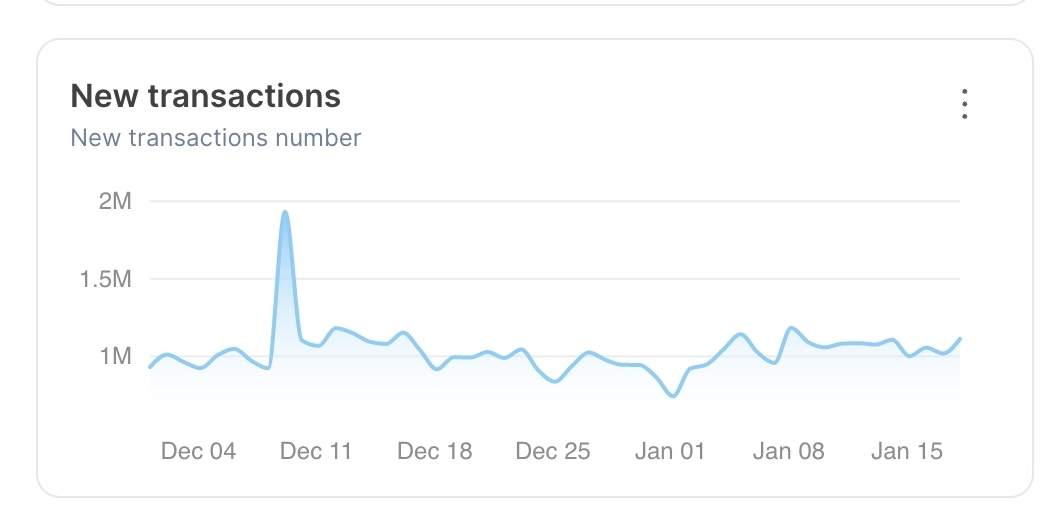
Example line chart where the X axis is date, and the Y axis is some data.
 ### Counter Charts
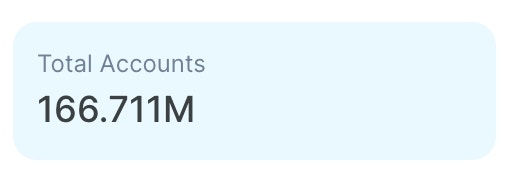
Single value, typically related to sums.
### Counter Charts
Single value, typically related to sums.
 ## Chart configuration
Blockscout has a set of predefined charts, which can be enabled or disabled using `charts.toml` file. Default charts config can be found here: [https://github.com/blockscout/blockscout-rs/blob/main/stats/config/charts.toml](https://github.com/blockscout/blockscout-rs/blob/main/stats/config/charts.toml)
This file can be used as a template. Customize by removing unnecessary or unrelated charts from `.toml` file. For example, here is a configuration with only block-related statistics:
```toml theme={null}
[[counters]]
id = "totalBlocks"
title = "Total Blocks"
update_schedule = "0 0 */3 * * * *"
[[counters]]
id = "averageBlockTime"
title = "Average Block Time"
units = "s"
update_schedule = "0 0 15 * * * *"
[[lines.sections]]
id = "blocks"
title = "Blocks"
[[lines.sections.charts]]
id = "newBlocks"
title = "New blocks"
description = "New blocks number"
update_schedule = "0 0 8 * * * *"
drop_last_point = true
[[lines.sections.charts]]
id = "averageBlockSize"
title = "Average block size"
description = "Average size of blocks in bytes"
units = "Bytes"
update_schedule = "0 0 9 * * * *"
drop_last_point = true
[[lines.sections.charts]]
id = "averageBlockRewards"
title = "Average block rewards"
description = "Average amount of distributed reward in tokens per day"
units = "ETH"
update_schedule = "0 0 20 * * * *"
drop_last_point = true
```
## Chart configuration
Blockscout has a set of predefined charts, which can be enabled or disabled using `charts.toml` file. Default charts config can be found here: [https://github.com/blockscout/blockscout-rs/blob/main/stats/config/charts.toml](https://github.com/blockscout/blockscout-rs/blob/main/stats/config/charts.toml)
This file can be used as a template. Customize by removing unnecessary or unrelated charts from `.toml` file. For example, here is a configuration with only block-related statistics:
```toml theme={null}
[[counters]]
id = "totalBlocks"
title = "Total Blocks"
update_schedule = "0 0 */3 * * * *"
[[counters]]
id = "averageBlockTime"
title = "Average Block Time"
units = "s"
update_schedule = "0 0 15 * * * *"
[[lines.sections]]
id = "blocks"
title = "Blocks"
[[lines.sections.charts]]
id = "newBlocks"
title = "New blocks"
description = "New blocks number"
update_schedule = "0 0 8 * * * *"
drop_last_point = true
[[lines.sections.charts]]
id = "averageBlockSize"
title = "Average block size"
description = "Average size of blocks in bytes"
units = "Bytes"
update_schedule = "0 0 9 * * * *"
drop_last_point = true
[[lines.sections.charts]]
id = "averageBlockRewards"
title = "Average block rewards"
description = "Average amount of distributed reward in tokens per day"
units = "ETH"
update_schedule = "0 0 20 * * * *"
drop_last_point = true
```