Prometheus
BlockScout is setup to export Prometheus metrics at/metrics.
- Install prometheus:
brew install prometheus - Start the web server
iex -S mix phx.server - Start prometheus:
prometheus --config.file=prometheus.yml
Grafana
The Grafana dashboard may also be used for metrics display.-
Install grafana:
brew install grafana -
Install Pie Chart panel plugin:
grafana-cli plugins install grafana-piechart-panel -
Start grafana:
brew services start grafana -
Add Prometheus as a Data Source
a.
open http://localhost:3000/datasourcesb. Click ”+ Add data source” c. Put “Prometheus” for “Name” d. Change “Type” to “Prometheus” e. Set “URL” to “http://localhost:9090” f. Set “Scrape Interval” to ”10s” -
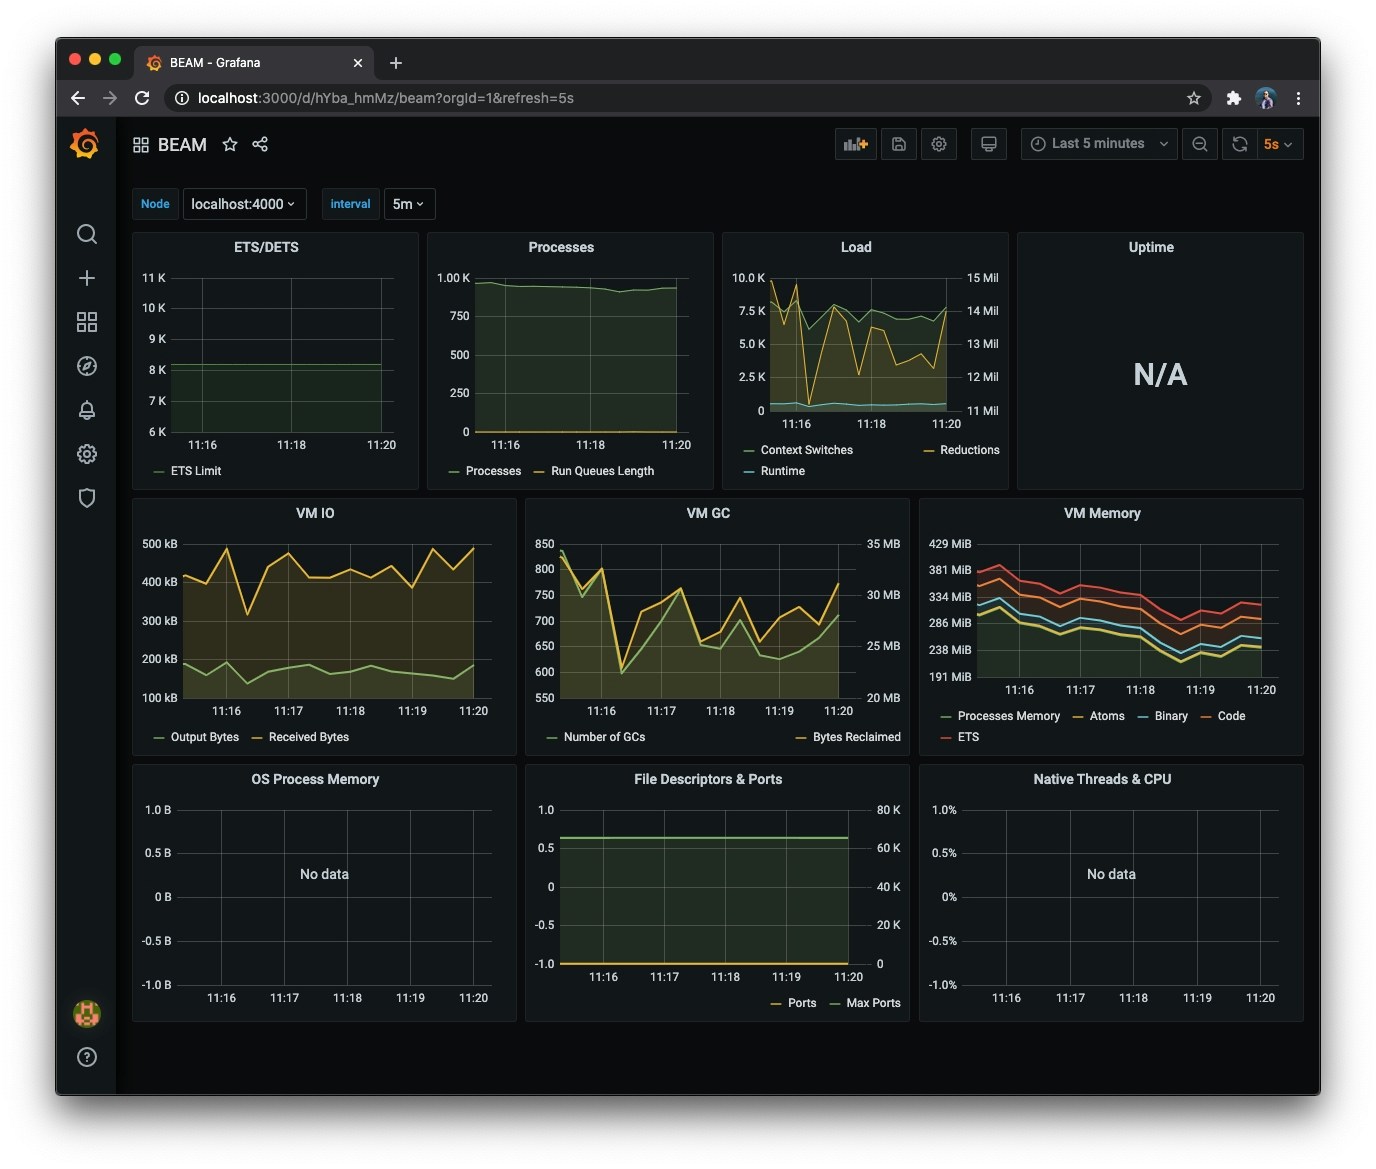
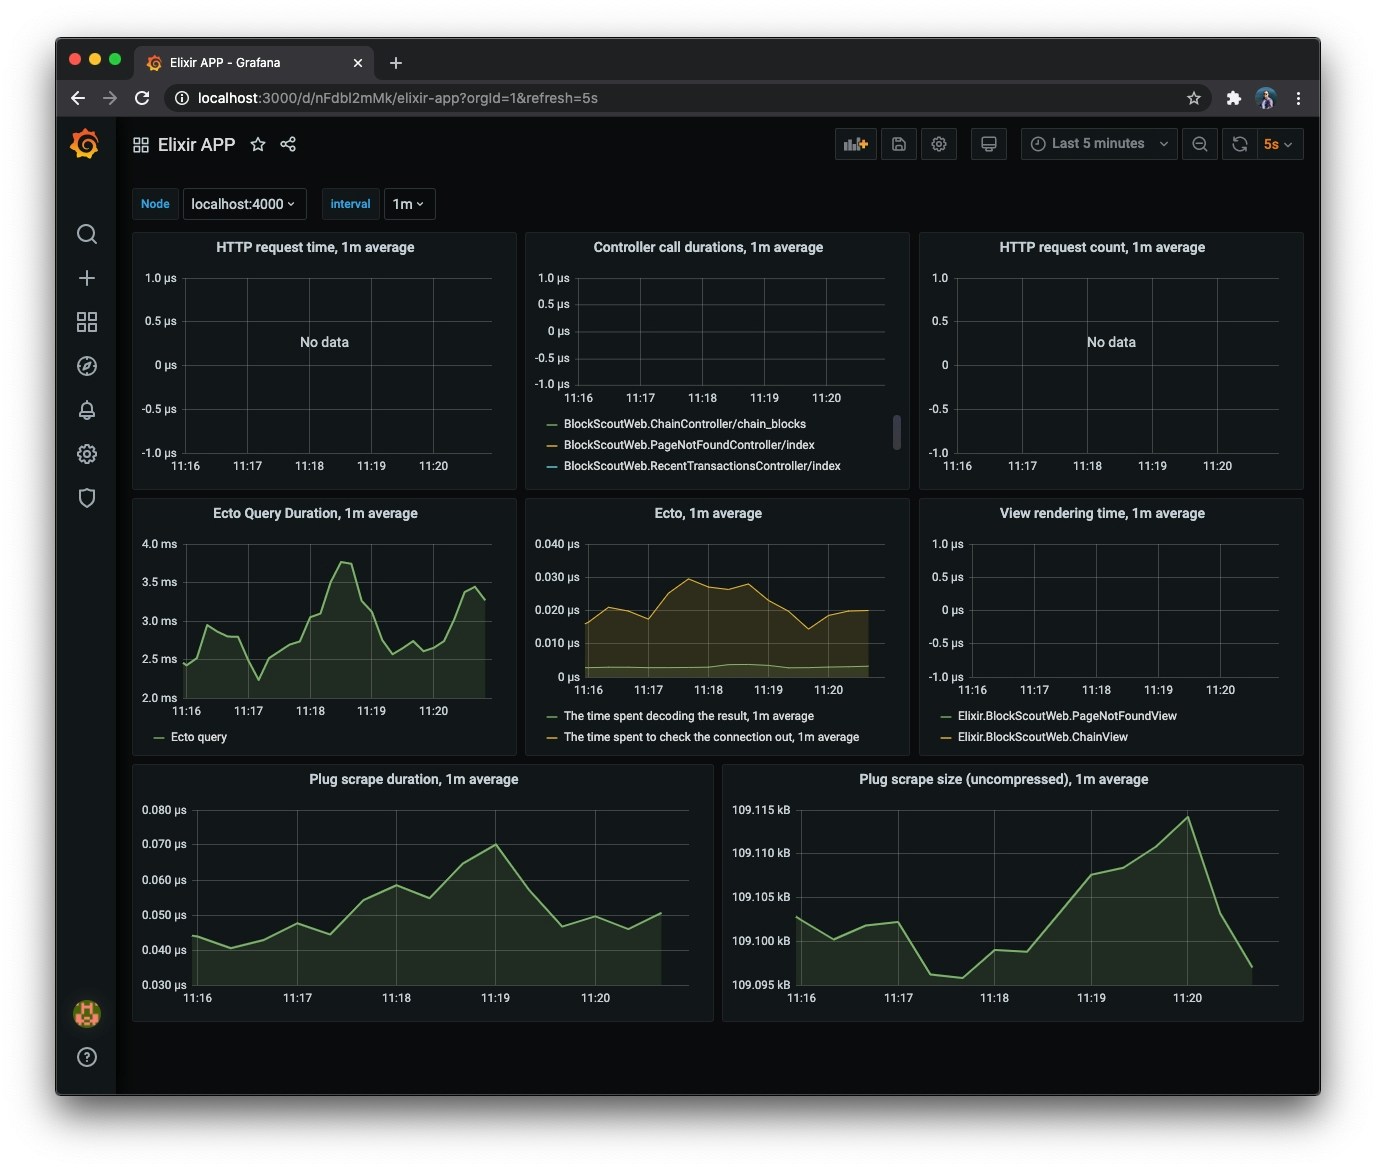
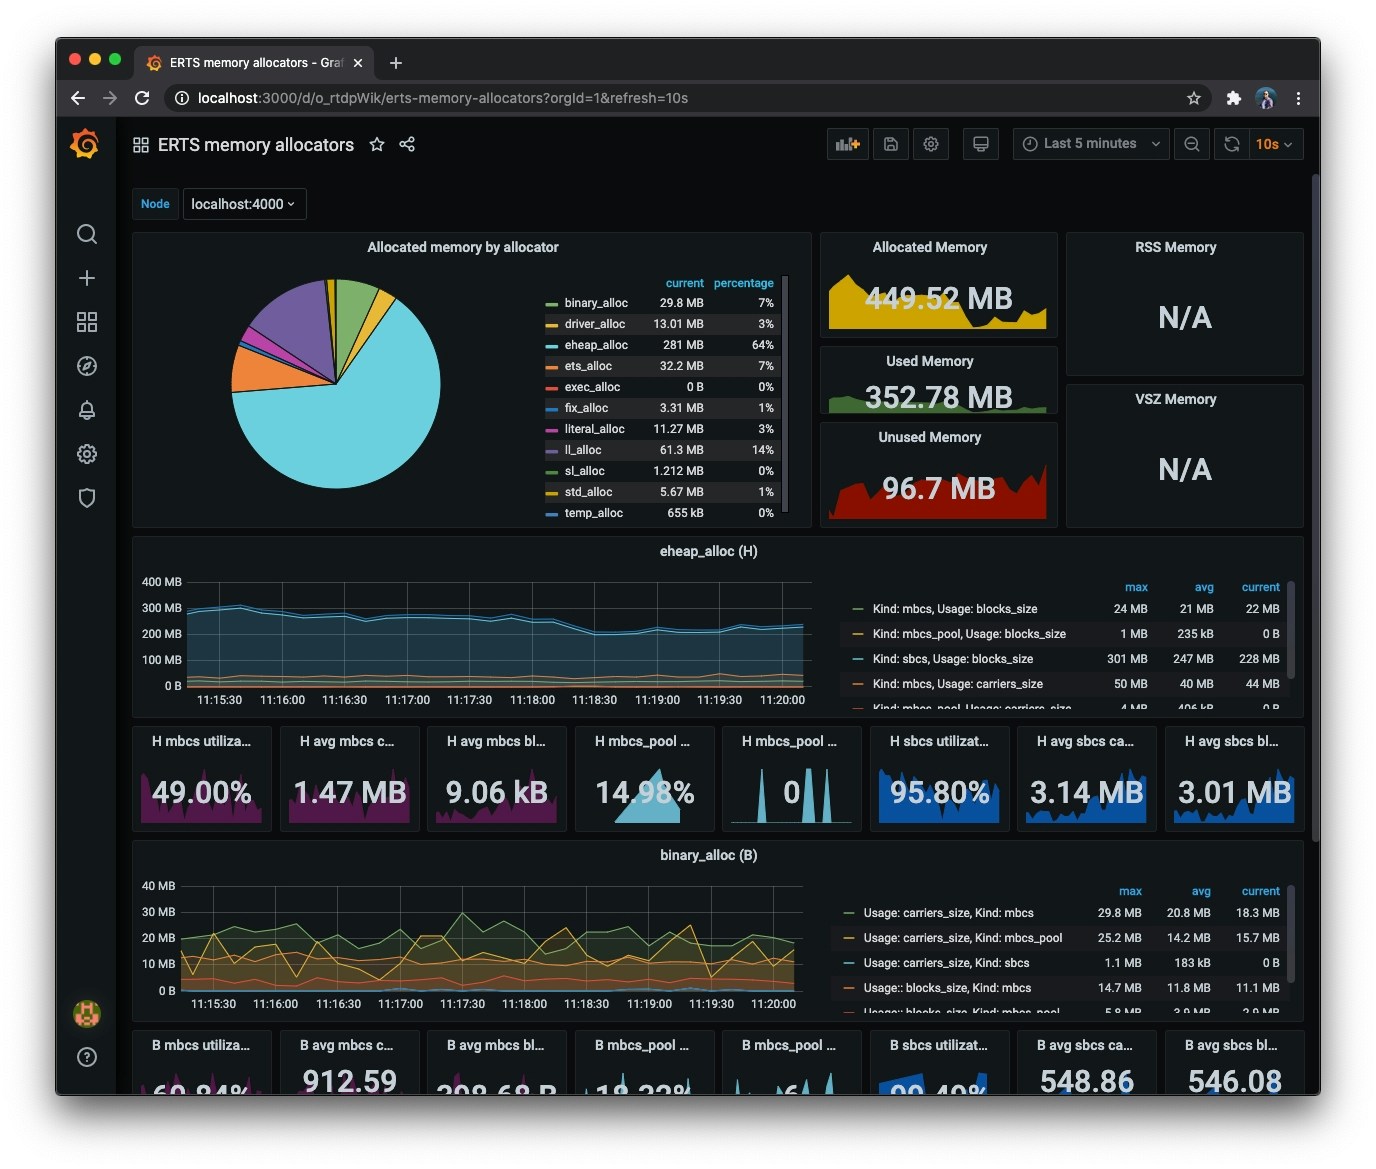
Add the dashboards from https://github.com/deadtrickster/beam-dashboards: For each
*.jsonfile in the repo. a.open http://localhost:3000/dashboard/importb. Copy the contents of the JSON file in the “Or paste JSON” entry c. Click “Load” - View the dashboards. (You will need to click-around and use BlockScout for the web-related metrics to show up.)